August 2024 Monthly Market Insights
Data and opinions as of July 31, 2024
From gains to turmoil: July’s gains turn into August’s woes
Concerns over a weakening labour market and the U.S. potentially falling into recession triggered a market correction that began in mid-July and took a sharp downturn in early August, wiping out the strong gains from the earlier part of July. The increase in the unemployment rate in July triggered the Sahm Rule, which has historically been an effective indicator of an onset of a recession. This rattled investors, leading to a sharp selloff in equities and a rally in bond prices. As of end of day August 5, the S&P 500 fell 8.5% from mid-July, and the 10-year U.S. Treasury yield slid to 3.78% from 4.23% on July 15.
Despite the pullback that started in mid-July, the S&P 500 and Dow Jones posted positive returns for July. However, August began with a sharp sell-off in both domestic and international markets, in reaction to the Bank of Japan’s (BoJ) surprise rate hike on July 31. The rate hike to 0.25% – the highest level in 15 years – and BoJ’s hawkish comments triggered the unwinding of carry trades (borrowing yen at lower interest rates to invest in foreign markets with higher returns), causing the soaring yen to send Japanese equities sharply lower. The TOPIX index dropped by 17.6% (JPY) in two trading sessions, marking the largest two-day decline since 1950. The yen rallied sharply by 10.8% from its lows in early July, back to levels seen in May.
The NEI perspective
Index volatility soared in the first three trading sessions in August, hitting an intraday high of 65. This in turn exacerbated market selloffs as it triggered the unwinding of “dispersion trades”.
91% of the companies in the S&P 500 have reported earnings so far, and 78% are reporting EPS higher than estimates.
One of this year’s laggards played catch up in July, as investors shifted towards small-cap equity stocks, which are more sensitive to interest rate cuts.
From NEI’s Monthly Market Monitor for July.

Canada: MSCI Canada; U.S.: MSCI USA; International: MSCI EAFE; Emerging markets: MSCI Emerging Markets. Source: Morningstar Direct

Canada investment grade: Bloomberg Barclays Canada Aggregate; Global investment grade: Bloomberg Barclays Global Aggregate; U.S. high yield: Bloomberg Barclays U.S. High Yield. Source: Morningstar Direct
Panic selloff spiked volatility
Index volatility soared in the first three trading sessions in August, hitting an intraday high of 65. This in turn exacerbated market selloffs as it triggered the unwinding of “dispersion trades”. Dispersion trades involve selling options on an index, which is typically relatively overpriced, to buy options on individual companies, which are typically underpriced. When index volatility soars, profitability on these trades sours, and the unwinding of these trades can exacerbate the selloff and volatility of the markets.
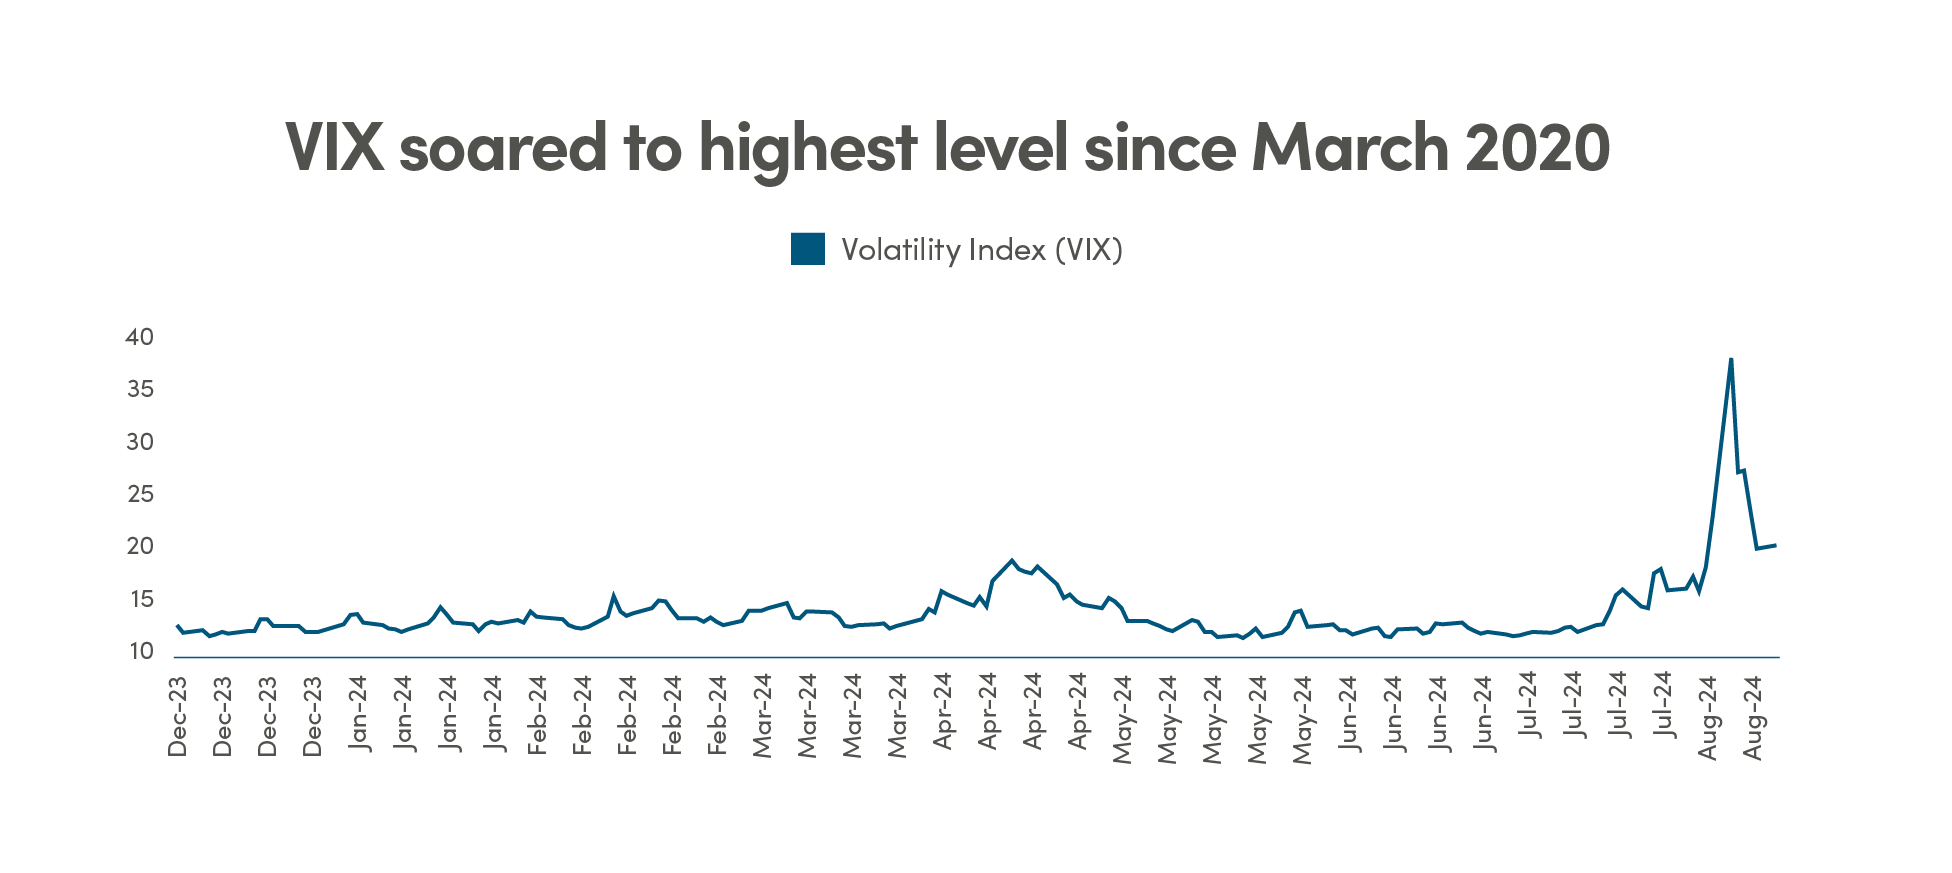
Source: Bloomberg.
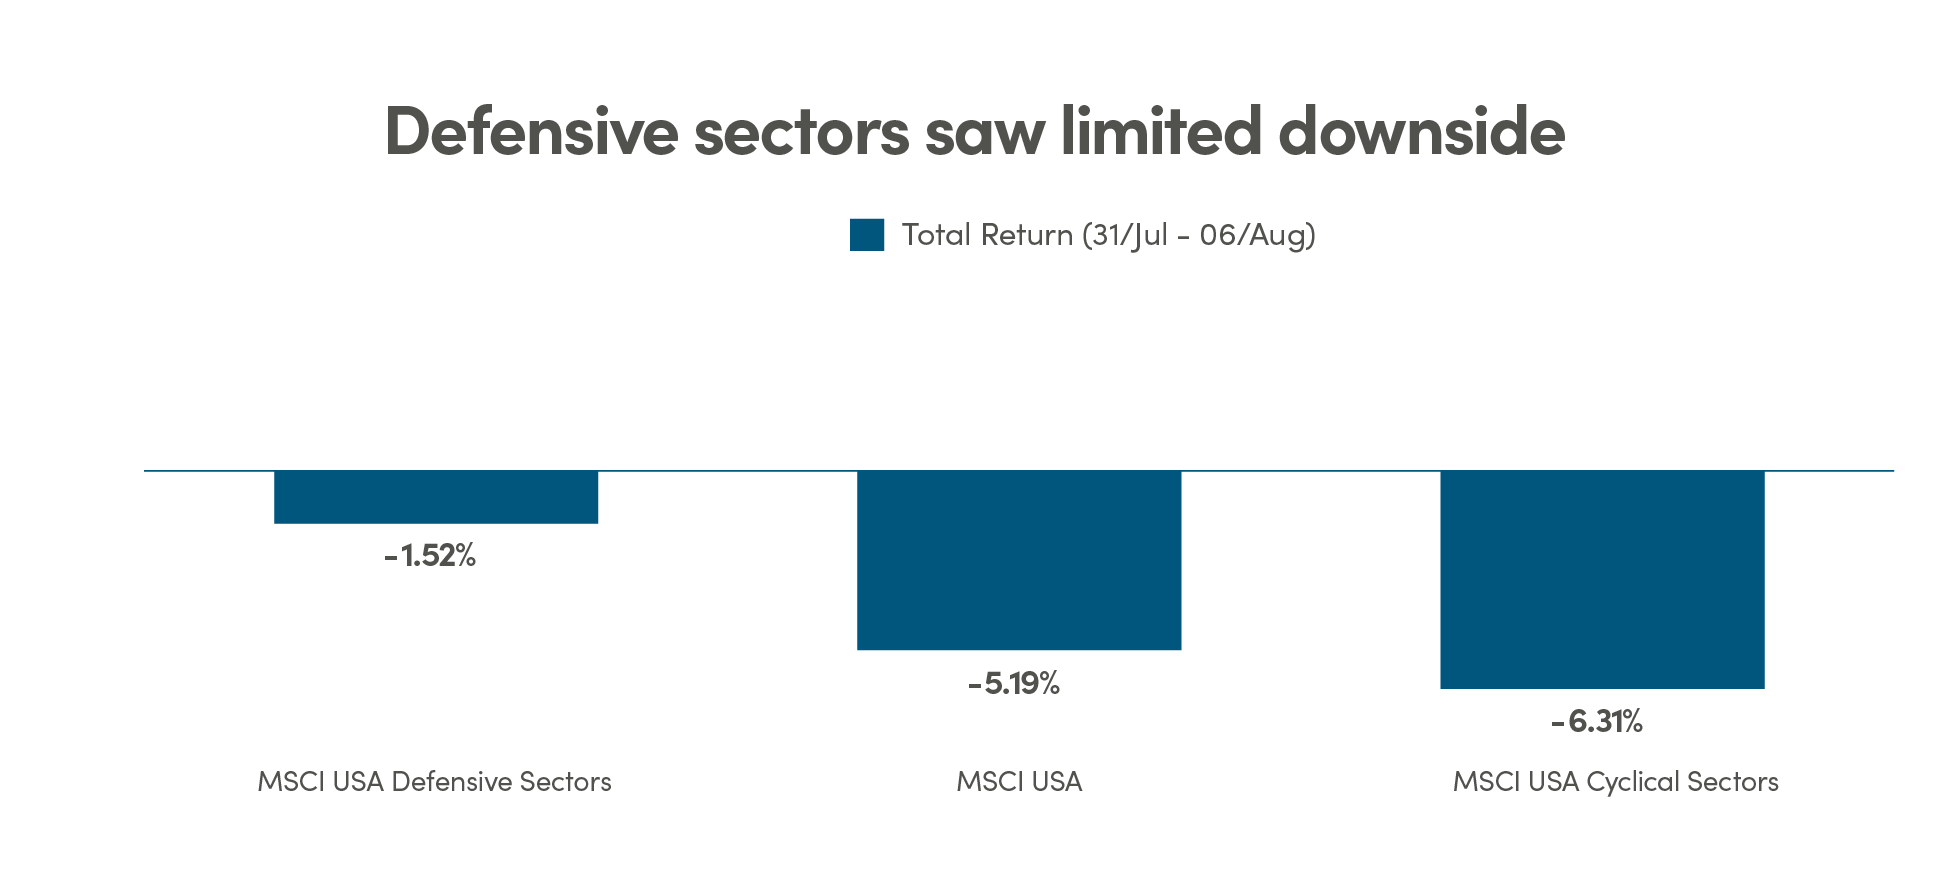
In this panic selloff, the magnitude of the drawdowns varied greatly by sectors and factors. Defensive sectors stood out as safe havens relative to the cyclical sectors. Low valuation held up better than companies that are rich on valuation, and large-cap companies outperformed small-cap companies. Importantly, bonds fulfilled their traditional risk mitigating role as higher bond prices offset stock price weakness during this period. We expect this relationship to be the norm going forward, unlike the past few years where higher interest rates caused both bonds and stocks to fall at the same time.
Double digit growth in U.S. earnings in Q2
91% of the companies in the S&P 500 have reported earnings so far, and 78% are reporting EPS higher than estimates. Although the percentage of S&P 500 companies reporting positive earnings surprises is above average levels, the market’s high expectations are rewarding positive EPS surprises less than average and punishing negative EPS surprises more than average. Overall, the index is reporting its highest year-over-year earnings growth rate at 10.8% since Q4 2021, the fourth consecutive quarter of year-over-year earnings growth. It also marks the first quarter since 2022 where the other 493 companies reported positive quarterly earnings growth.
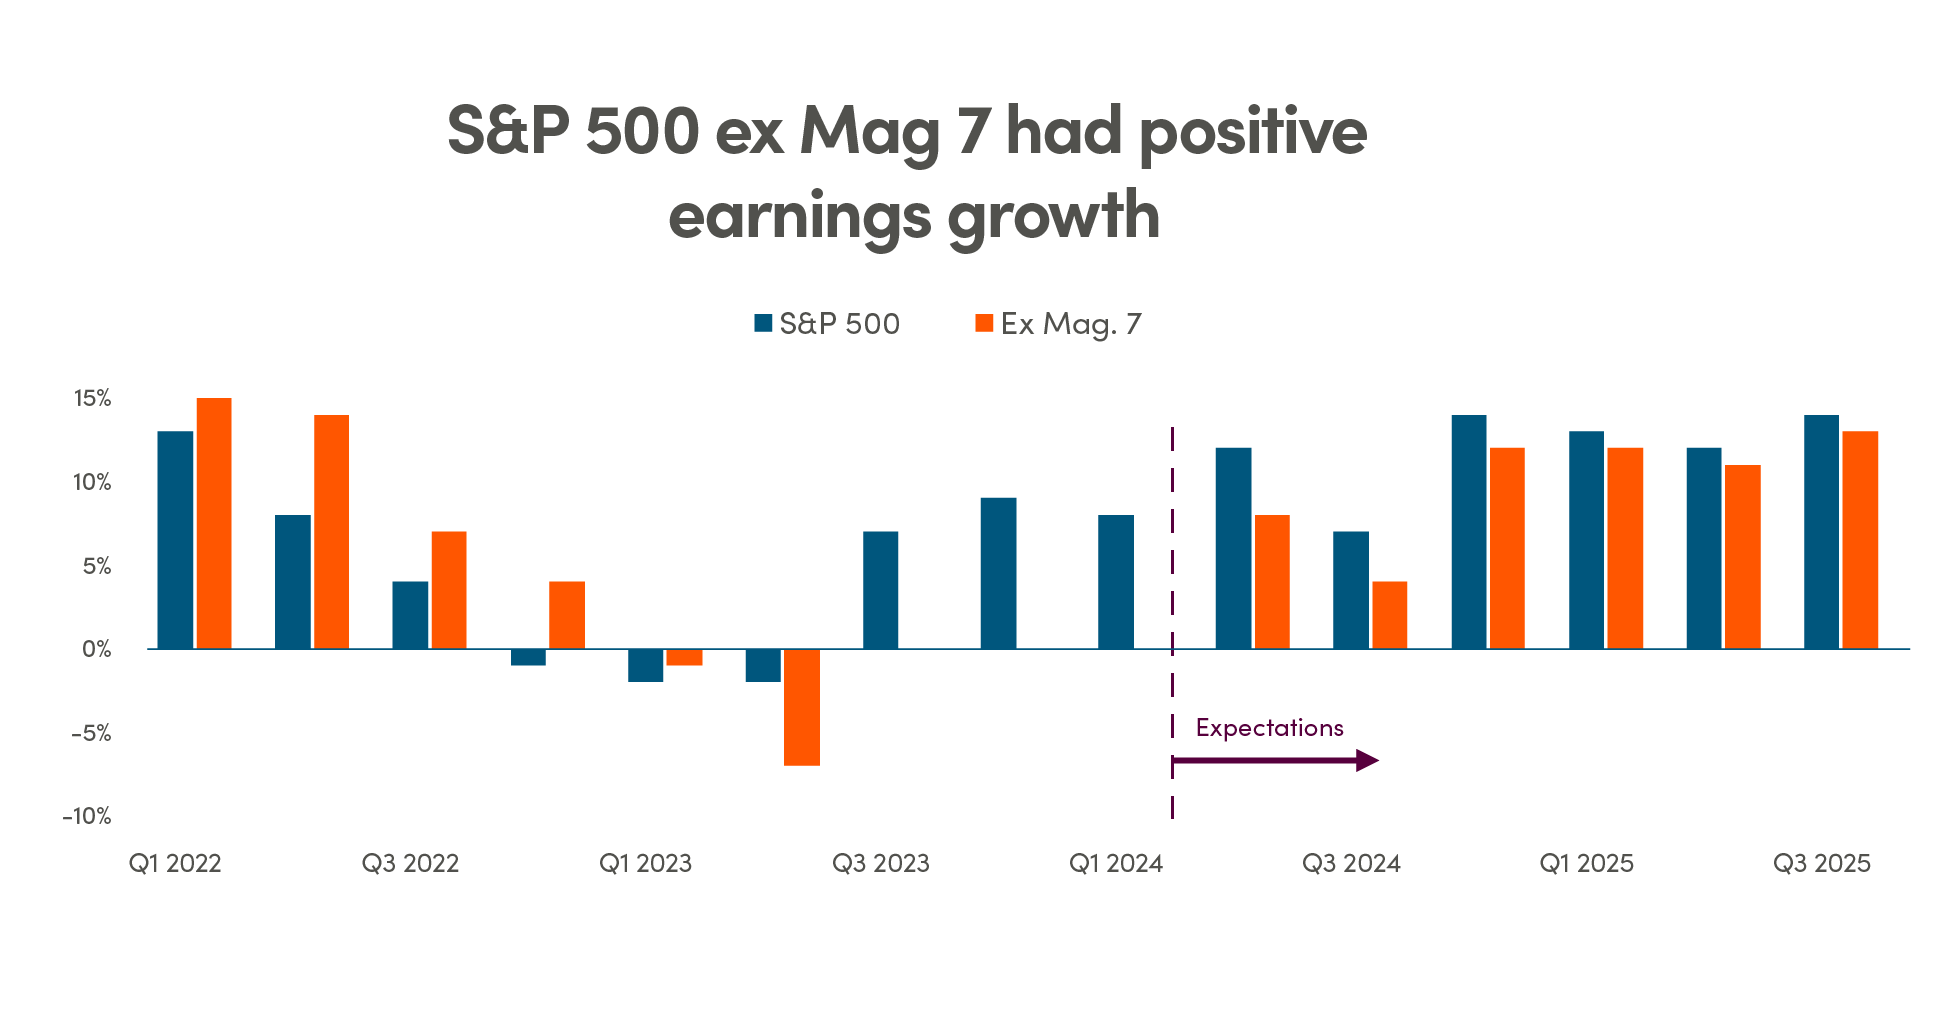
Source: Factset.
Looking ahead, consensus estimates for earnings growth in Q3 and Q4 of 2024 stand currently at 5.4% and 15.7%, which translates to earnings growth of 10.2% for the calendar year 2024, suggesting a resilient U.S. economy. Following the Q2 reporting season, estimates for FY2025 earnings have held steady and resilient, at almost 14% growth, making the U.S. the strongest country among developed markets.
Bottom line: The U.S. equity market continues to be concentrated not only on price returns but also earnings contribution. A small number of companies are contributing a significant portion of earnings, increasing volatility and vulnerability on the index. Notwithstanding the latest drawdown, the premium on U.S. valuations reflect a soft-landing scenario with high expected earnings growth. Companies require material upside catalysts to get further upside or valuation gain, while companies that deliver negative surprises get punished. We expect the U.S. market to be rangebound until year-end, and investors need to be selective and stay disciplined with regular rebalancing to mitigate concentration risk.
July rotation to small cap in historic proportions
One of this year’s laggards played catch up in July, as investors shifted towards small-cap equity stocks, which are more sensitive to interest rate cuts. The increased likelihood for rate cuts, following the soft U.S. inflation print and weaker U.S. labour market data, likely triggered the largest one-month outperformance in over 20 years of the Russell 2000 versus the Nasdaq 100 Index of 13.34%.
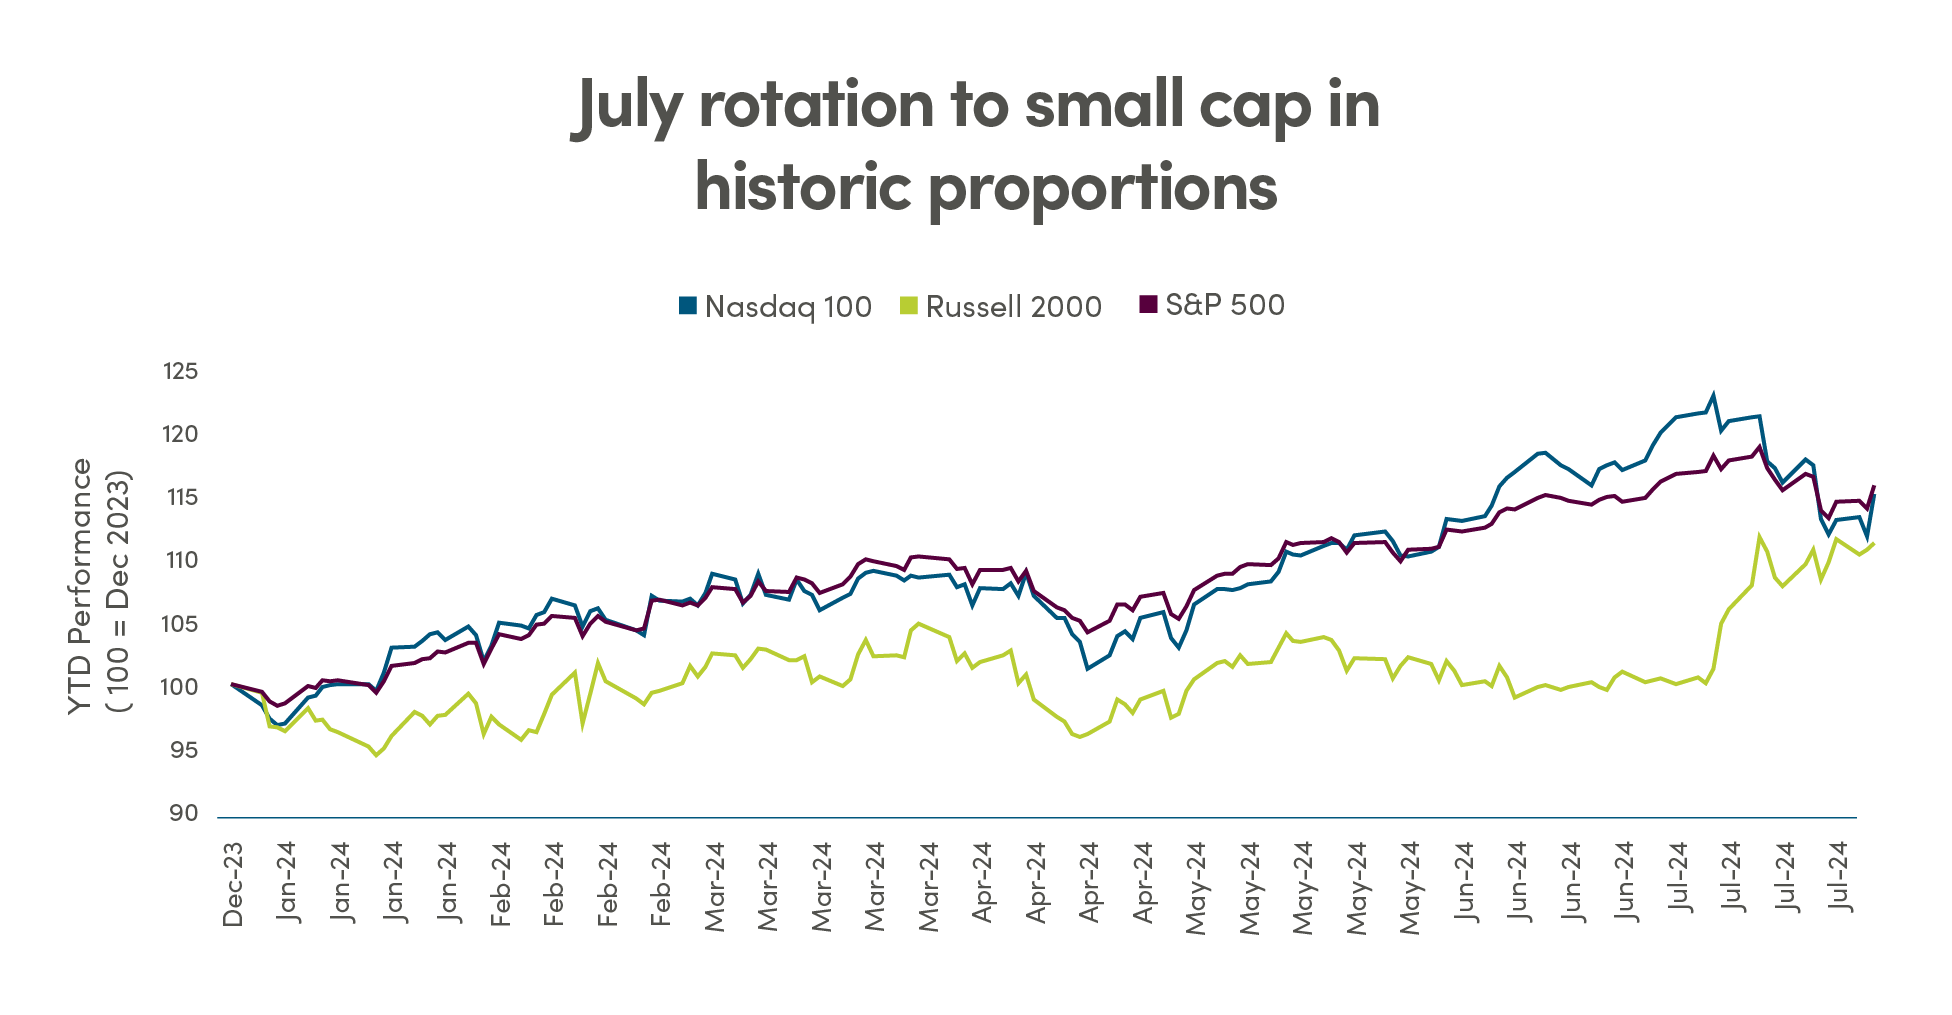
Source: Bloomberg.
Bottom line: The rotation was surprisingly sooner and bigger in magnitude than expected, as small cap rotation typically happens when economic growth begins to accelerate, not when it’s decelerating, and forward-looking earnings growth in the small-cap companies typically needs to be accelerating as well. It is not the case at this point. While we continue to believe that the high-quality segment within the small-cap space is attractive, we believe this rebound could be short-lived, and the more sustainable recovery could still be ahead.
Legal
Aviso Wealth Inc. (“Aviso Wealth”) is the parent company of Credential Qtrade Securities Inc. (“CQSI”), Credential Asset Management (“CAM”), Qtrade Asset Management (“QAM”) and Northwest & Ethical Investments L.P. (“NEI”). NEI Investments is a registered trademark of NEI. Any use by CQSI, CAM, QAM or NEI of an Aviso Wealth trade name or trademark is made with the consent and/or license of Aviso Wealth. Aviso Wealth is a wholly-owned subsidiary of Aviso Wealth Limited Partnership, which in turn is owned 50% by Desjardins Financial Holdings Inc. and 50% by a limited partnership owned by the five Provincial Credit Union Centrals and the CUMIS Group Limited.
This material is for informational and educational purposes and it is not intended to provide specific advice including, without limitation, investment, financial, tax or similar matters. This document is published by CQSI, CAM and QAM and unless indicated otherwise, all views expressed in this document are those of CQSI, CAM and QAM. The views expressed herein are subject to change without notice as markets change over time. Views expressed regarding a particular industry or market sector should not be considered an indication of trading intent of any funds managed by NEI Investments. Forward-looking statements are not guaranteed of future performance and risks and uncertainties often cause actual results to differ materially from forward-looking information or expectations. Do not place undue reliance on forward-looking information. Mutual funds are offered through Credential Asset Management Inc. Mutual funds and other securities are offered through Credential Qtrade Securities Inc. Commissions, trailing commissions, management fees and expenses all may be associated with mutual fund investments. Please read the prospectus before investing. Unless otherwise stated, mutual fund securities and cash balances are not insured nor guaranteed, their values change frequently and past performance may not be repeated.
The MSCI information may only be used for your internal use, may not be reproduced or re-disseminated in any form and may not be used as a basis for or a component of any financial instruments or products or indices. None of the MSCI information is intended to constitute investment advice or a recommendation to make (or refrain from making) any kind of investment decision and may not be relied on as such. Historical data and analysis should not be taken as an indication or guarantee of any future performance, analysis, forecast or prediction. The MSSCI information is provided on an “as is” basis and the user of this information assumes the entire risk of any use made of this information. MSCI, each of its affiliates and each other person involved in or related to computing, computing or creating any MCI information (collectively, the “MSCI Parties”) expressly disclaims all warranties (including, without limitation, any warranties of originality, accuracy, completeness, timeliness, non-infringement, merchantability and fitness for a particular purpose) with respect to this information. Without limiting any of the foregoing, in no event shall any MSCI Party have any liability for any direct, indirect, special, incidental, punitive, consequential (including, without limitation, lost profits) or any other damages.